Our post using data from the 2016 Census is here and can be used for comparison! These illustrations show the 2021 data using the same heat map styles and colour ranges to help identify rates and extent of changes.
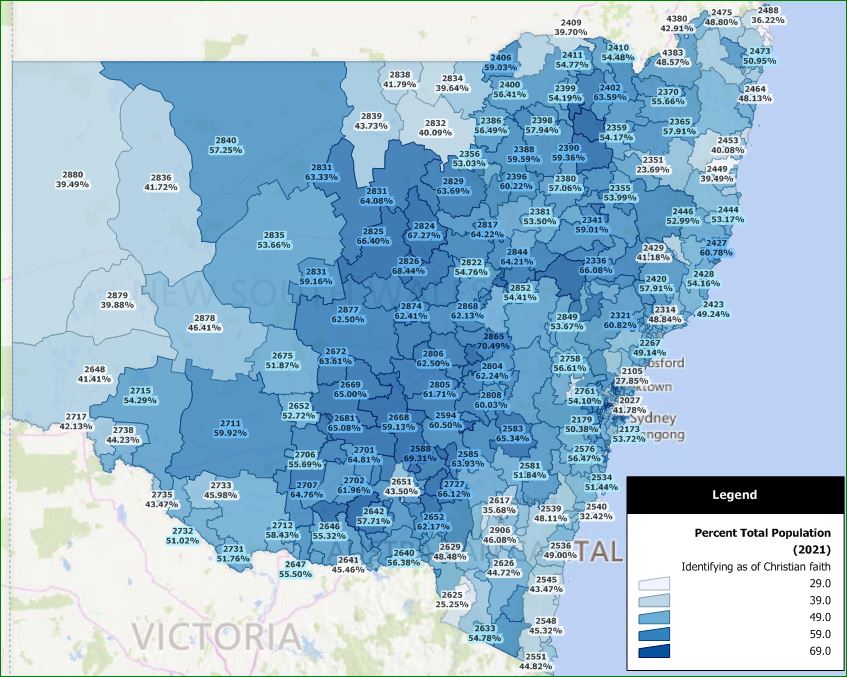
Percent total population nominating some form of Christianity as their faith in the 2021 Census – NSW / ACT
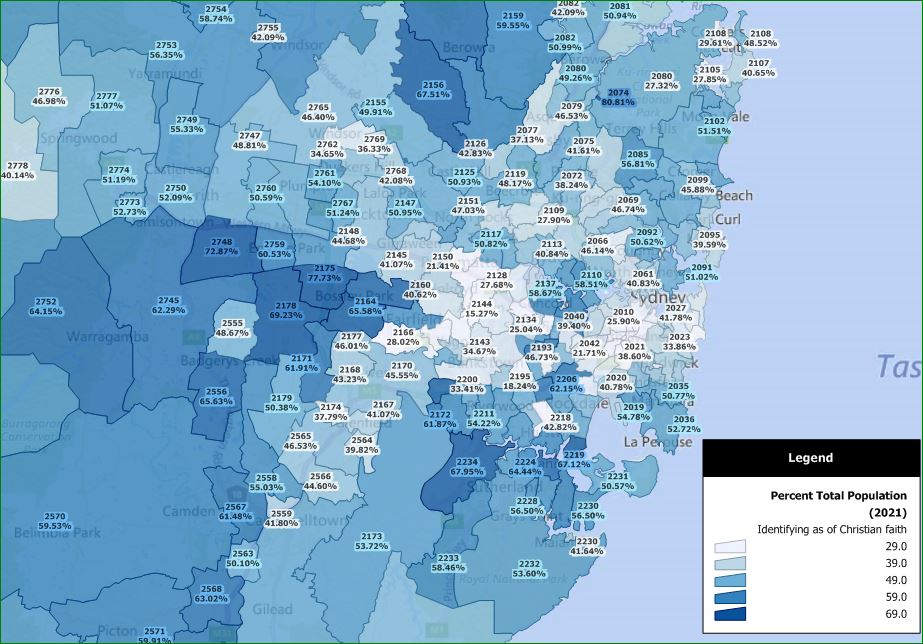
Percent total population nominating some form of Christianity as their faith in the 2021 Census – Greater Sydney
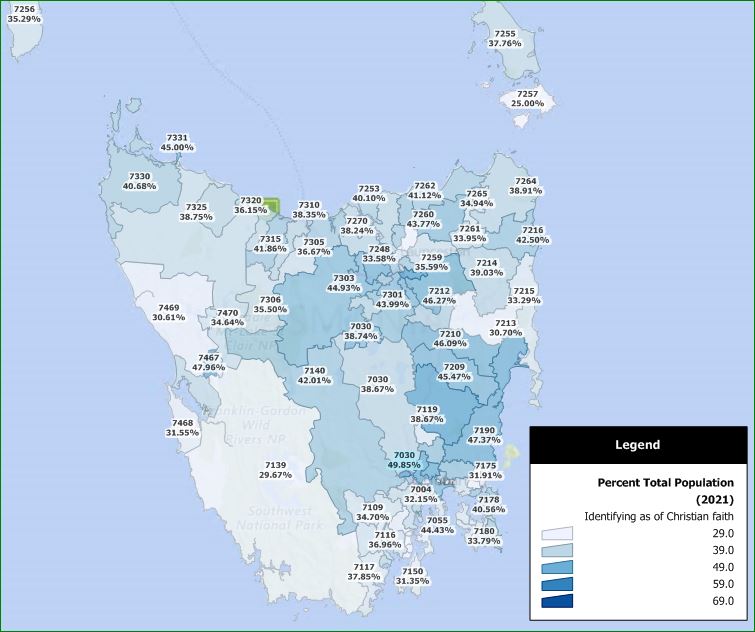
Percent total population nominating some form of Christianity as their faith in the 2021 Census – Tasmania
There is a striking decrease in the percentage of the population identifying as Christian in the five years since the 2016. The average for our sample regions was 56.3% in 2016. In 2021 the figure is 47.6, an overall 8.5% decrease. Need similar insights for other social characteristics and other regions? Get informed, get the data!
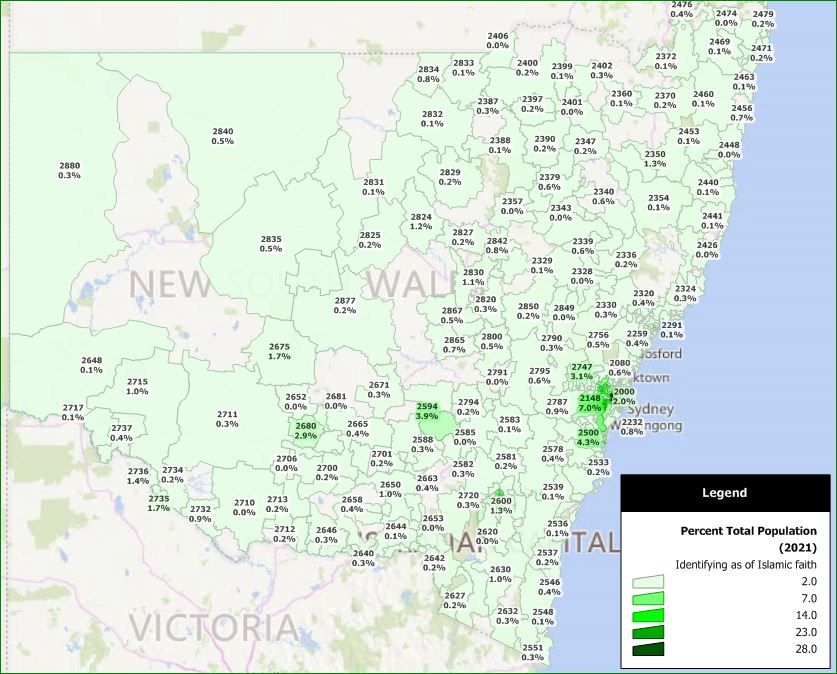
Percent total population nominating some form of Islam as their faith in the 2021 Census – NSW / ACT
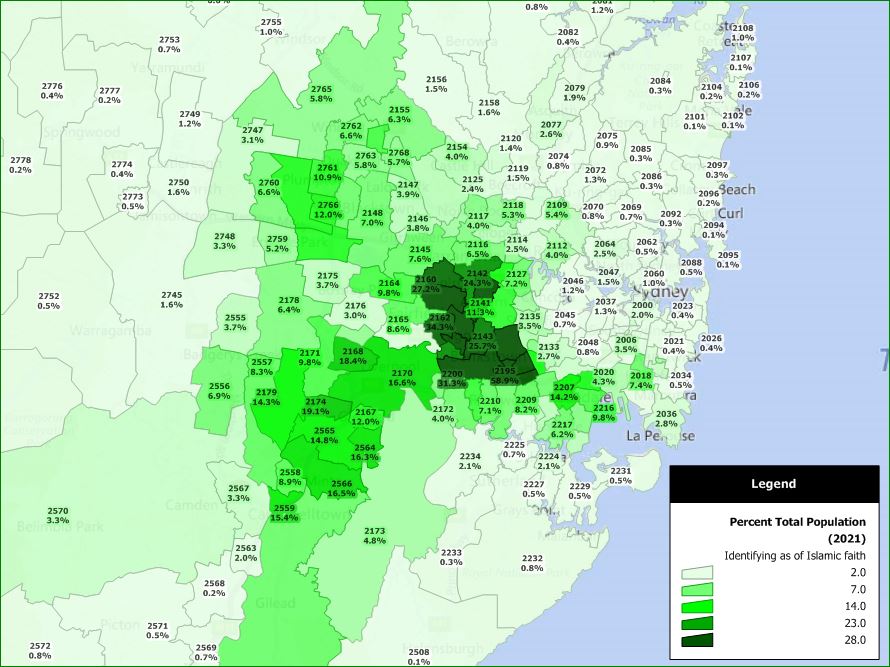
Percent total population nominating Islam as their faith in the 2021 Census – Greater Sydney
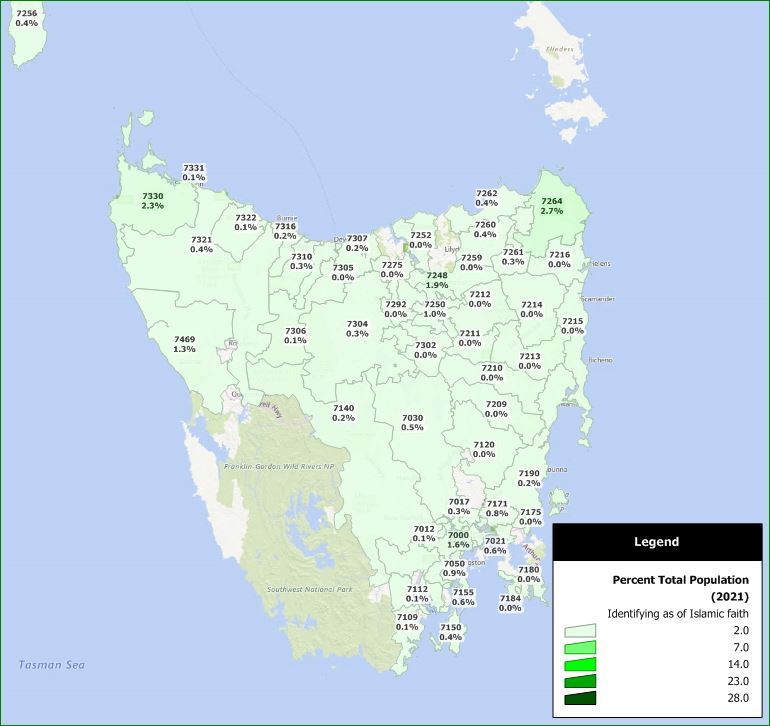
Percent total population nominating some form of Islam as their faith in the 2021 Census – Tasmania
Until the arrival of WuFlu and subsequent border closures in March 2020, the huge annual intake of migrants – many from developing regions of primarily Islamic faith – continued unabated. With a nominal requirement for three years residency in regional Australia before a typical move to culturally similar suburbs in the major capitals, the trend can be seen.
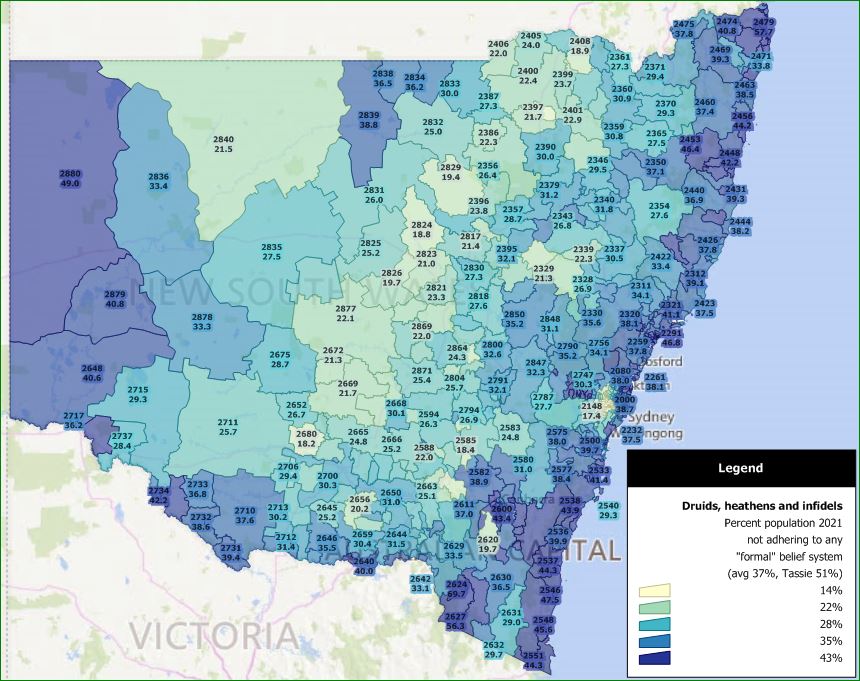
Percent total population nominating no religion or some form of secular belief as their faith in the 2021 Census – NSW / ACT
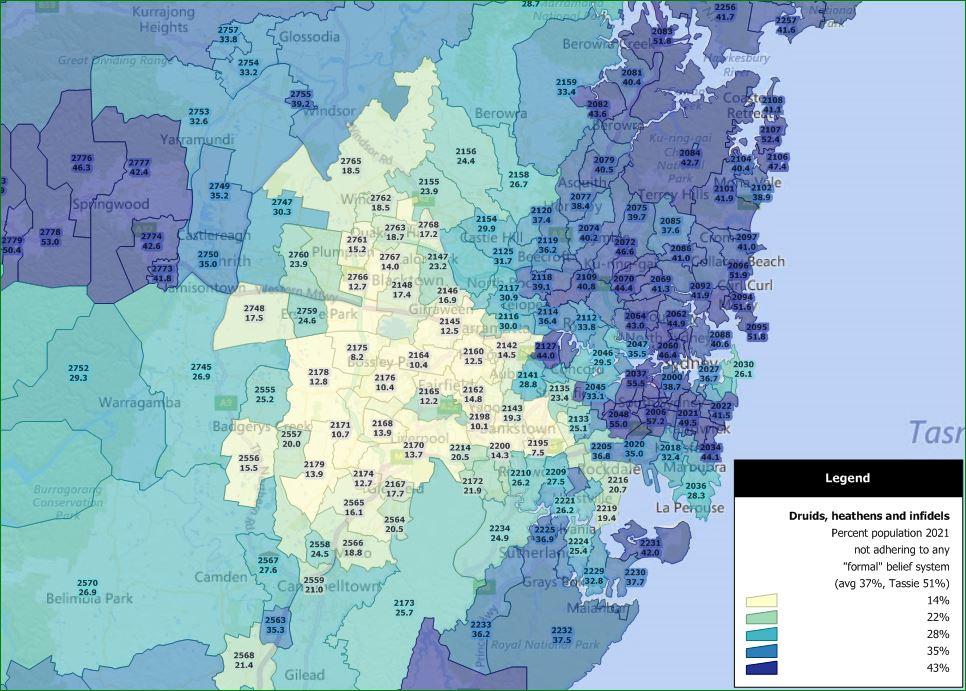
Percent total population nominating no religion or other secular as their “faith” in the 2021 Census – Greater Sydney
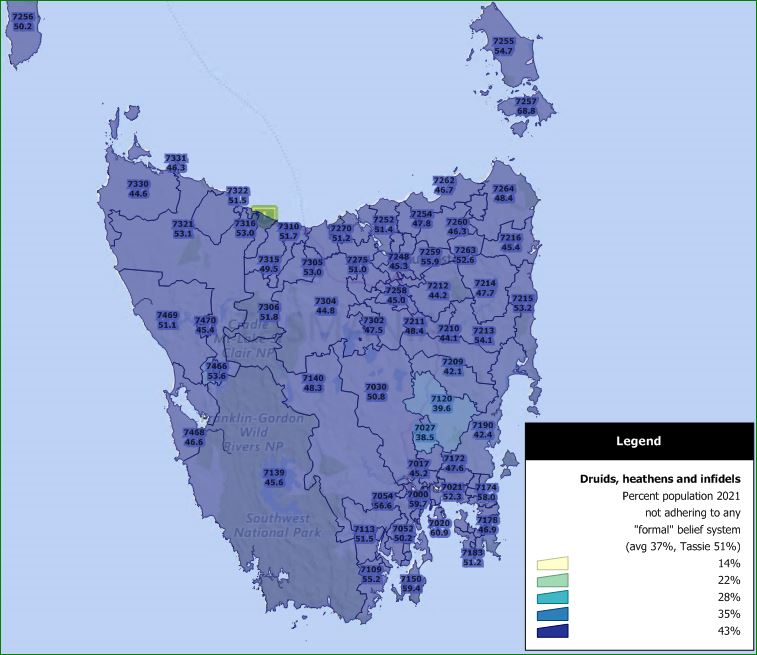
Percent total population nominating some form of no religion or some form of secular belief as their faith in the 2021 Census – Tasmania
Compared to the decline in Christianity noted above, the secular population for the region shown has changed from 27.9% in 2016 to 37.2% in 2021. For Tassie in particular, the change is from 38.6% in 2016 to a whopping 50.8% in 2021 – a loss of “faith” of almost 32% in just five years!
