The following examples use ABS data on business activity. We have processed these to integrate them with our postcode GIS data products to present them at postcode level. (If you’ve come back here via a bookmark for the annual Business Count by Postcode Area updates, they’ve now been moved to their own post here).
The map below shows the total number of businesses having at least one employee, for postcode areas around Sydney, NSW.
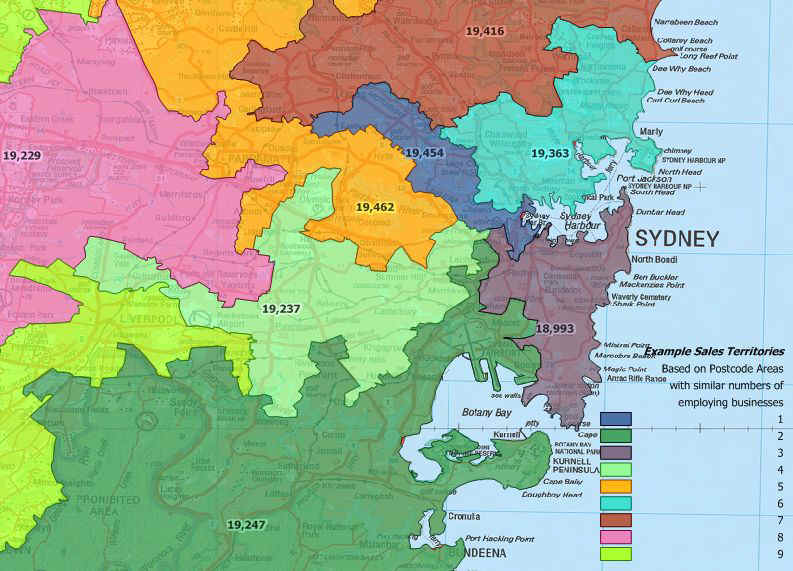
We are sometimes asked whether we can generate sales or franchise territories based on “number of businesses”. The process is similar to that required when using Census demographics.
This map is the result of processing MapMakers Postcode area data to include the total number of employing businesses, and generate 9 sales territories, each of which has a similar (and thus fair) number of businesses in it. The numbers on the map show the total number of employing businesses in each territory based on the postcode areas within.
We can even analyse for trends in actively trading businesses over time.
As always, if you have your own in-house data relating to business activity of specific interest, or wish to compile such data from other independent sources, we could use that in a similar way.
Of course you may wish to target only business of a certain size.
For example a coffee machine leasing operator may feel that their most reliable and well priced machine is ideal for businesses with perhaps 20 employees (though probably too expensive a proposition for a sole trader or really small firm). This map shows where such businesses, employing between 5 and 19 people, are distributed and how many are primarily located in each postcode.
The data could be used in a similar way to the Territory map above, to produce sales territories for potential franchisees.
Data is also available for business sector category, and financial turnover.
This example combines both these types of data to map the distribution and number of businesses operating in the “Retail Trade” sector, but only those operations turning over less than $150,000 per annum.
Here’s a quick reference list of the default ABS “Industry Divisions”:
-
- Agriculture Forestry and Fishing
- Mining
- Manufacturing
- Electricity, Gas, Water and Waste Services
- Construction
- Wholesale Trade
- Retail Trade
- Accommodation and Food Services
- Transport, Postal and Warehousing
- Information Media and Telecommunications
- Finance and Insurance Services
- Rental, Hiring and Real Estate Services
- Professional, Scientific and Technical Services
- Administrative and Support Services
- Public Administration and Safety
- Education and Training
- Health Care and Social Assistance
- Arts and Recreation Services
- Other Services

Map using ABS data integrating business category (e.g. “Retail Businesses”) and annual dollar turnover amounts.
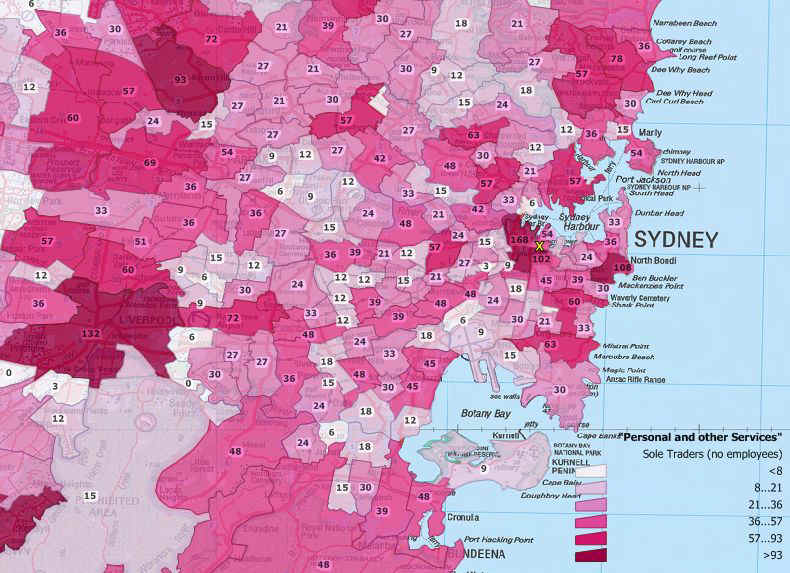
There is also a category for “none employing” which can be taken to represent sole traders and other single person businesses.
This map shows the distribution and numbers of such businesses operating in the “Personal and Other Services” sector from the default list reproduced above and for the same area as the four previous maps.
Of course if you are considering undertaking a territory mapping exercise using such data, it is important to feel comfortable with what the raw statistics are likely to represent. As with all ABS data, care is taken to protect the privacy of individuals and businesses, so the user must take some time to consider where the information of specific interest is likely to reside in the general statistics available.
In this map, the location of Kings Cross is marked with an “X”, but there are obviously many types of businesses which would be grouped together in the same very broad category of “Personal and Other Services”!
Note: The ABS has revised its standard geographical classification. Postcode level data is not available after 2006, with most recent business data (2020) compiled to new standard level, which is of only limited use for most territory planning work. We can restructure these data to a best approximation at postcode area level; this is a custom mapping task and is charged at standard rates. Contact sales with your requirements. We monitor ABS and other relevant site activity regularly and will continue to post updates as / when available (this information last updated August 2020).

Map showing number of sole trader businesses in the “Personal and Other Services” category (Kings Cross, Sydney marked with a “X”).
Historical change to total number of businesses per postcode area can be seen for this area from 2011 to the current year in this dedicated post.


