September 2022. Owing to pandemic measures from March 2020, we have delayed posting further business count updates to our long running series until 2023. With so many small and medium enterprises failing and many of those remaining struggling to return to profitability, direct comparison for trends should be made cautiously, with the above in mind.
Here we can begin to see the real impact of imposed restrictions.

Percent change in number of operating businesses 2011 to 2021
The growth and spread of the “deteriorating” orange trend since the previous reporting period shows the impact on the private sector of restrictions imposed by Governments as part of the “emergency responses” from March 2020. Put simply, a negative number means massive business closures and bankruptcy. For example postcode 2064 – Artamon, Sydney, had 2,459 businesses trading in 2011 (Total number, no distinction made based on turnover or number of employees – we can do that for you, and for other areas of the country, of course!), the number in 2021 was 1,798 – a reduction of 26.9%, despite the population growing by over 9% in the same period (see below). Interestingly the largest concentration of improving private sector activity was in and around Canberra and the ACT, all those additional public sector employees need to buy their shoes and coffees somewhere!
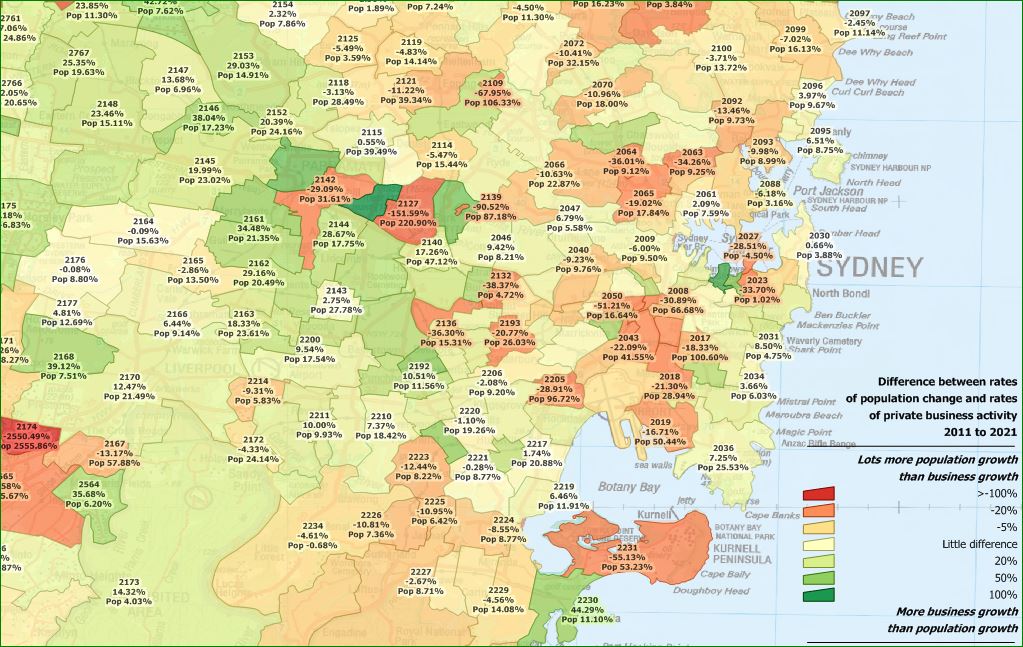
Another way of drilling into these data is to express the change in raw business numbers in proportion to the change in population over the same period. This image shows the results of this analysis.

Proportional change in business numbers to population 2011 – 2021
The larger the negative numbers, the bigger the gap – fewer business, more people (for reference, the change in population is included in the label, preceded by “Pop”). A few postcodes bucked the overall trend and showed a much larger growth in businesses compared to population. For example Silverwater 2128 is a popular commercial centre with water access and a big growth in commerce, with a lower than average resident population growth, owing to limited residential space.

2128 Silverwater Commercial and Population Growth 2011 to 2021
The ABS business count data is presented at SA2 level, you can find it here. We re-distribute it accurately to postcode areas; most of us can relate to a postcode area, few even know what an SA2 is. Be aware that not all postcode labels are shown on our web graphics and some are automatically offset from their default geographic centres. This is done primarily for aesthetics and visual clarity. If you engage us commercially, of course everything is clear!
