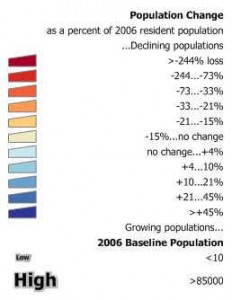
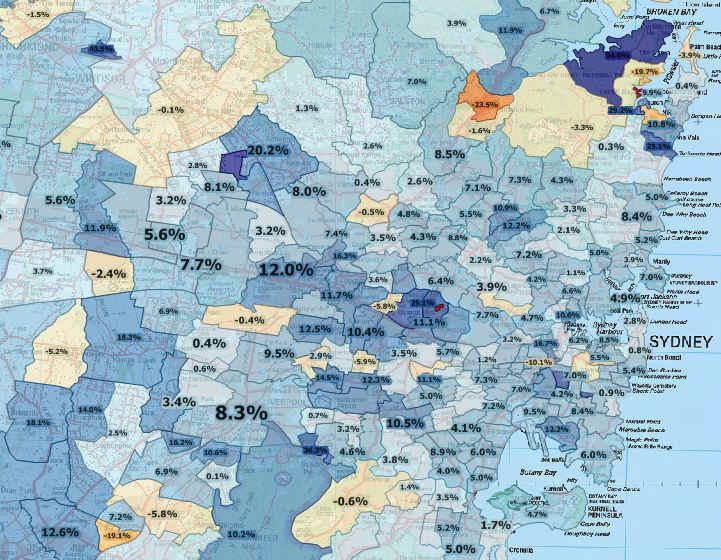
The continuing trend in drift of populations from the bush to regional towns and major cities is illustrated in these maps, comparing the total population in each postcode using 2006 populations as the baseline, i.e. 2006 population is 100%.
The trend is further illustrated by using smaller labels to indicate smaller starting population numbers..
When zoomed in to the greater Sydney region, the rapid population growth of some suburbs already with high populations in 2006 becomes very clear.
Immigration and urban planners can use insights like these to fine-tune policies and plans. Both 2006 and 2011 MapMakers Census products contain a rich array of default demographic data to underpin this kind of research and analysis (the small red area just right of centre is the Concord Repatriation Hospital – postcode 2139, hopefully indicating far fewer sick beds occupied in 2011!).


