
We were asked recently if we could create some territories highlighting “.. postcodes with wealthy families who needed, and could afford to pay top rates for child care“? As usual with these type of decision support questions, the answer was a qualified “yes”. Why qualified? It’s because the individual or group seeking the insight ideally needs to get a feel for the variables involved and ultimately decide where we “draw the line” on their behalf. In this case that might mean specifying a dollar value for disposable income and for the number of pre-school children in the proposed areas. Fortunately we have some very sophisticated tools at your disposal to help gain these insights.
In this example, we’ve used our census enhanced GIS product for South Australia. We’ve calculated values for monthly disposable household income by using other values relating to total family incomes, minus weekly or monthly rent or mortgage payments. The product has separate figures for boys between the age of 0 and 4, and for girls the same age. We summed the two give the total number of pre-schoolers (the next age group is 5 – 14 years, so that wouldn’t meet the requirement). This is where things get a bit complicated for many – how do you find those places which have a good mix of both high disposable income households, plus a large population of pre-school age children? Call MapMakers, of course.

Control how you value different criteria. Good default values can be customised to leverage your own insights and knowledge.
In this case, for each postcode we’ve calculated the percentage each matches both criteria (high disposable income plus large pre-school population). We’ve let the system determine the settings for high disposable income, but have adjusted the system figure for acceptable numbers of pre-schoolers (240) to a figure we’re more comfortable as representing a good pool, to 450. Here are the results in map form.
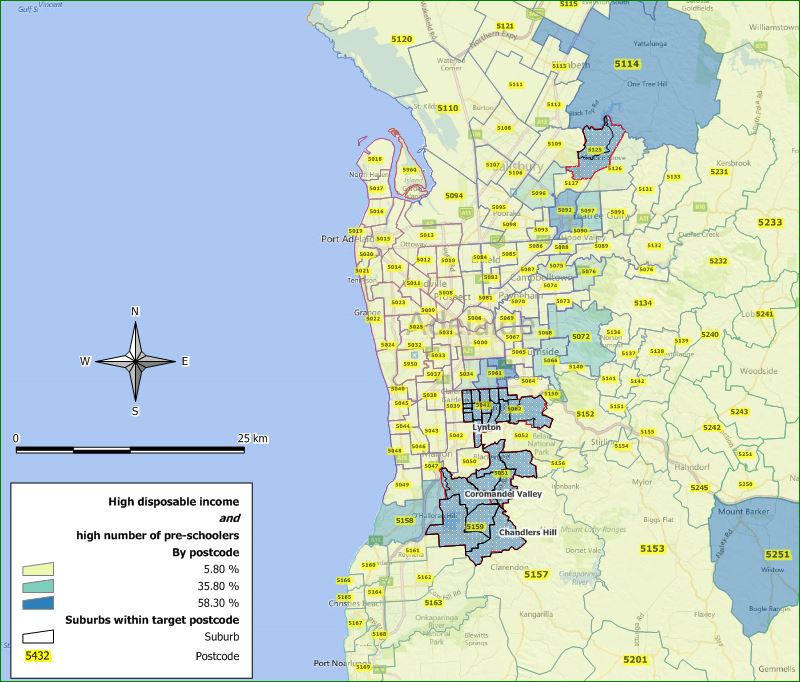
Wealthy postcodes with lots of young children in need of care.
Anyone familiar with the suburbs of Adelaide will not be too surprised by the distribution. The top five postcodes are highlighted.
Here’s a zoomed in view where the suburb names can be seen more clearly.

Adelaide suburbs of comfortably off families with pre-school children, who could afford premium child care.
This enquirer was interested in establishing a franchise model for their child care system. Our quality data and leading edge analytical tools allow us to offer such premium services, allowing you to back up your territory offerings with hard facts. Of course it is you who ultimately must advise us what numbers you wish us to implement on your behalf (modifications to the “450” value in this example) as it is you who will selling your territories, but we can guide you to that point. Of course in a franchising exercise (more examples elsewhere on the site), this example is just one potential step along the way, hopefully it will give an idea of just how much is possible, with a little planning. Thanks for reading!
Good evening. Thank you…Excellent article.
Great info. Lucky me I found your blog by accident (stumbleupon).
I’ve bookmarked it for later!